Challenge
QA and engineering leaders lacked a single source of truth for team performance. Jira showed bug counts and TestRail showed execution logs, but there was no reliable way to connect quality, efficiency, and impact across teams.
Approach
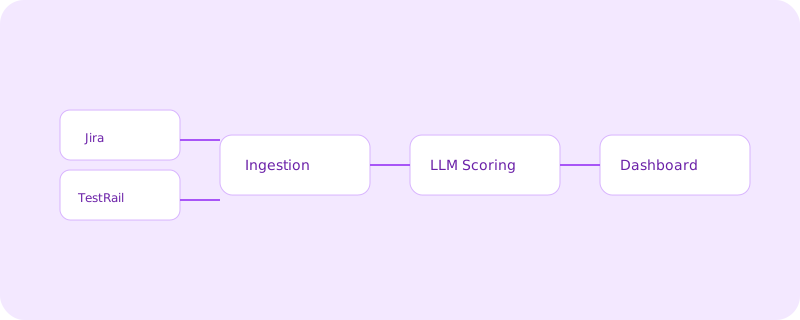
- Built a unified dashboard that ingests Jira and TestRail data via API or CSV.
- Added an LLM-based quality review (Gemini via Genkit) to score bug clarity and reproducibility.
- Designed a multi-factor scoring model that rewards valid bugs and penalizes noise.
- Visualized time-based and execution efficiency per project and contributor.
Results
- Managers gained a consistent, data-driven way to coach performance and reduce noise.
- Cross-project visibility improved, highlighting bottlenecks and training gaps quickly.
- Quality scoring made release and performance reviews faster and more objective.
Key metrics
| Metric | Before | After |
|---|---|---|
| Bug review effort | Manual, inconsistent | Automated LLM scoring |
| Visibility | Siloed Jira/TestRail | Unified dashboard |
| Performance insight | Subjective | Multi-factor scoring |
- Quality scoring works only with shared definitions and review criteria.
- Time-based efficiency reveals training needs faster than raw throughput.
- Dashboards must translate data into coaching actions, not just metrics.